Why Solar Installations Jumped 40% in Q1 2026 — And What It Really Means for Homeowners
By the Solanano Editorial Team | Solar Market Intelligence | Published 2026
Key Takeaways
- Global solar demand remains structurally strong, even as U.S. utility-scale numbers contracted 27% year-over-year in Q1 2026
- Residential solar grew 6% in the U.S., bucking the broader industry contraction — driven by falling module prices and the shift to third-party ownership models
- 45% of new residential solar installations were paired with battery storage in Q1 2026, signaling a decisive move toward home energy resilience
- Module prices hit a new low of $0.34/Wdc, down 21% from Q1 2025 — making system economics more favorable than ever for homeowners
- India surged 143% year-over-year to 15.3 GW, proving what policy clarity can unlock at scale
- California homeowners navigating NEM 3.0 have more reason than ever to pair solar with storage — and to choose their installer carefully
Setting the Record Straight: What Actually Happened in Q1 2026
Let's address the headline directly: U.S. solar installations did not jump 40% across the board in Q1 2026. In fact, the overall U.S. market installed 7.8 GWdc of new capacity, representing a 27% decline year-over-year, according to the SEIA/Wood Mackenzie Q2 2026 Solar Market Insight report.
So where does the 40% figure come from? It reflects specific market segments and regions — including residential solar's quiet but meaningful resilience, India's extraordinary 143% year-over-year surge, and the accelerating integration of battery storage into new installations. The real story of Q1 2026 isn't one number. It's a market sorting itself out under pressure — and still finding pockets of extraordinary growth.
Understanding which parts of solar are booming, which are contracting, and why, is exactly the kind of intelligence that helps California homeowners make smarter decisions. Let's break it down.
The U.S. Market: Contraction at the Top, Resilience at the Bottom
The utility-scale sector bore the brunt of Q1's headwinds. Policy uncertainty, new anti-dumping and countervailing duty (AD/CVD) tariffs on imported panels, and persistent permitting delays squeezed large project pipelines hard. The result: a market that, in raw gigawatt terms, looks like it took a significant step backward.
But zoom in on the residential segment, and the picture shifts.
U.S. residential solar grew 6% year-over-year in Q1 2026 — a modest but meaningful number given the backdrop of elevated interest rates, the high-profile bankruptcy of a major national installer, and ongoing financing challenges. What kept residential afloat?
- Falling module prices: Residential solar module prices dropped to $0.34/Wdc in Q1 2026, down from $0.43/Wdc in Q1 2025. That's a 21% price reduction in twelve months, meaningfully improving system payback periods.
- Third-party ownership (TPO) models: With financing costs elevated, more homeowners turned to solar leases and power purchase agreements (PPAs) to go solar with little or no upfront cost. TPO adoption accelerated significantly in Q1 2026.
- Tech-sector demand: AI-driven data centers are quietly reshaping utility-scale solar demand. Contracts for large-scale solar projects rose 15% year-over-year, driven almost entirely by technology companies with aggressive clean energy procurement targets.
As Dr. Elena Vance, Lead Analyst at Renewable Energy Markets, put it: "While the headline numbers show a contraction, the underlying demand from AI-driven data centers and the resilience of the utility-scale pipeline suggest a robust long-term trajectory."
One other number deserves its own paragraph: solar and battery storage combined accounted for 91% of all new power capacity added to the U.S. grid in Q1 2026. In a quarter defined by contraction, clean energy still dominated new generation. That is not a minor footnote — that is a structural shift in how America builds its grid.
India and China: Two Very Different Stories
The global context matters, especially for understanding supply chains and module pricing that directly affect California homeowners.
India's 143% surge to 15.3 GW in Q1 2026 is one of the most remarkable solar deployment stories in recent memory. It reflects what happens when a government pairs policy clarity with serious infrastructure investment — competitive procurement programs, streamlined approvals, and grid expansion running in parallel with generation capacity. As Rajesh Kumar, Director of Solar Research at South Asia, observed: "The 143% surge in India demonstrates that when policy clarity meets infrastructure investment, solar deployment can scale at an unprecedented pace."
China, by contrast, saw installations fall from 59.71 GW AC in Q1 2025 to 41.39 GW AC in Q1 2026 — still an almost incomprehensibly large number, but a genuine cooling. The primary driver: China's transition to market-based pricing systems for solar energy, which removed some of the policy-driven urgency that fueled its record-breaking 2025 numbers. This is a maturing market recalibrating, not a market in crisis.
For California homeowners, the China story has an indirect but real implication: continued downward pressure on global panel manufacturing costs, even as U.S. tariff policy creates price friction at the import level.
The Storage Surge: 45% of New Residential Solar Now Includes Batteries
This is the trend that deserves the most attention for anyone considering solar in California right now.
45% of new residential solar installations in Q1 2026 were paired with battery energy storage. That number has climbed steadily over the past two years, and in California, the reasons are structural, not aspirational.
Under NEM 3.0, the economics of solar-only systems have fundamentally changed. Without storage, homeowners export excess solar generation at significantly reduced compensation rates — sometimes as low as $0.02–$0.05/kWh — while buying power back from utilities like SCE or LADWP at peak rates that can exceed $0.45/kWh. The math no longer works the way it did under NEM 2.0.
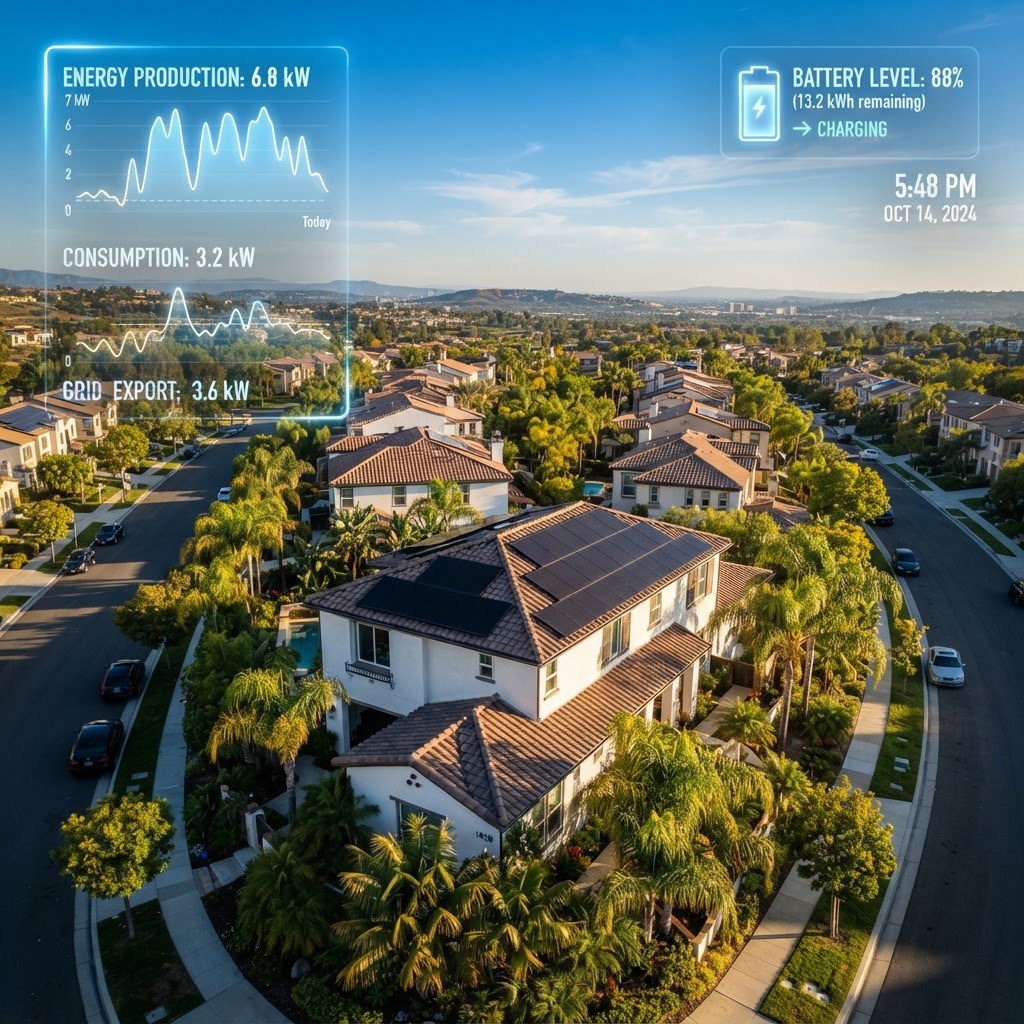
With a battery, the equation flips. Homeowners store their own solar generation, consume it during peak rate windows, and dramatically reduce their grid dependence. This is what Solanano calls the nano-grid philosophy — treating your home not as a passive utility customer but as a semi-independent energy node that can generate, store, and manage its own power.
California also offers the SGIP (Self-Generation Incentive Program) rebate for battery storage — a program with remaining funding that can meaningfully offset battery installation costs. Timing matters. Solanano's financial modeling incorporates SGIP availability, NEM 3.0 rate structures, and utility-specific tariffs from SCE, BWP, and other California providers to build projections that reflect what homeowners will actually experience on their bills — not what a sales pitch promises.
What the Headwinds Mean for California Homeowners
The headwinds buffeting the broader U.S. market — tariff uncertainty, permitting delays, installer consolidation — are real, and California homeowners should factor them into their decisions.
What to watch:
- AD/CVD tariffs on solar panels from certain manufacturing origins are adding cost uncertainty to project pipelines. Module prices may not continue their downward trajectory at the same pace.
- Installer financial health matters more than it did two years ago. The bankruptcy of a major national installer in Q1 2026 left thousands of customers in difficult warranty and service situations. Vetting your installer's financial stability, licensing, and track record is not optional.
- Permitting delays in some California jurisdictions are extending project timelines. Working with an installer who has local permitting experience — and a track record of successful inspections — reduces this risk.
This is precisely why Solanano's 4-stage installer qualification process exists. Every installer in the Solanano network has been screened for active licensing and insurance, NABCEP certification, project track record, and ongoing performance scoring. In a market where installer quality varies enormously and some companies are under financial stress, independent vetting isn't a luxury — it's basic due diligence.
Texas, Ohio, and the Shifting U.S. Solar Map
Texas maintained its position as the fastest-growing U.S. solar market in Q1 2026, a dominance driven by land availability, favorable interconnection policy, and enormous corporate clean energy procurement. More surprising: Ohio emerged as a top-three state for solar deployment — a signal that solar is no longer a Sun Belt story. Manufacturing incentives, data center buildout, and improving economics are pulling solar investment into new geographies.
For California, this geographic diversification is mostly good news. A more distributed national solar industry means more competition among manufacturers, installers, and financing providers — ultimately benefiting consumers through better pricing and service options.
Bottom Line
Q1 2026 was a quarter that punished oversimplified narratives about solar. The U.S. utility market contracted under real pressure, while residential solar quietly grew, storage adoption accelerated, India set records, and clean energy still accounted for nearly all new U.S. grid capacity. The fundamentals — falling costs, rising resilience demand, structural policy support — remain intact. For California homeowners, the window to act is genuinely compelling: module prices are near historic lows, SGIP incentives are available now, and a solar-plus-storage system designed around NEM 3.0 realities can deliver both bill savings and energy independence that no utility rate increase can touch.
The question isn't whether solar makes sense in 2026. The question is whether you have the right information — and the right installer — to make it work for your specific home, utility, and financial situation.
Ready to find out what solar and storage could actually do for your home? Get a free, no-obligation solar assessment from Solanano — independent advice, hyperlocal financial modeling, and access to California's most thoroughly vetted solar professionals.