Why Solar Installations Jumped 40% in Q1 2026: The Forces Behind the Industry's Biggest Quarter Ever
By the Solanano Editorial Team | Solar Engineering & Project Advisory | California
Key Takeaways
- Global solar capacity additions hit a record 128 GW in Q1 2026 — a 40.2% increase over Q1 2025
- Federal permitting reforms unlocked a 120 GW backlog of utility-scale projects almost overnight
- Solar-plus-storage attachment rates surged to 78% globally, signaling a fundamental shift to "Firm Solar"
- The levelized cost of solar-plus-storage dropped to $54/MWh in high-irradiance regions — now cheaper than nearly every fossil fuel alternative
- US domestic module manufacturing capacity jumped 54% year-over-year to 65.5 GW, reshaping the supply chain
- For California homeowners, these macro forces translate directly into better equipment, faster timelines, and stronger financial returns under NEM 3.0
The Numbers Don't Lie: Q1 2026 Was a Historic Quarter
The global solar industry doesn't break records quietly. According to the Global Energy Review 2026, solar capacity additions reached 128 GW in Q1 2026 alone — a 40.2% year-over-year increase that left even the most optimistic forecasters recalibrating their models.
To put that in perspective: the industry added more clean capacity in three months than the entire US grid contained from all sources just fifteen years ago. This wasn't a regional anomaly or a one-country sprint. It was a synchronized, multi-continent surge driven by converging policy reforms, collapsing costs, technological breakthroughs, and an energy demand story that has fundamentally changed — largely thanks to AI.
"The 40% jump in Q1 2026 is the direct result of the 'great interconnection thaw.' The regulatory reforms of 2025 finally allowed the massive project backlog to hit the grid at once." — Dr. Alistair Thorne, Director of Grid Modernization, Clean Energy Institute
The "Great Interconnection Thaw": Regulatory Reform Finally Bites
For years, the single biggest chokepoint in US solar deployment wasn't technology or financing — it was the interconnection queue. Projects waited three, five, sometimes seven years to connect to the grid while paperwork accumulated and utilities ran exhaustive studies.
That logjam broke decisively in late 2025. Federal permitting reforms slashed interconnection wait times by 40%, and the effect was almost instantaneous: a 120 GW backlog of utility-scale solar and storage projects began flowing into operation in Q1 2026. These weren't new projects — they were fully financed, fully engineered developments that had been frozen in bureaucratic amber, waiting for a green light that finally arrived.
Simultaneously, PJM Interconnection — the nation's largest grid operator — proposed a complete design overhaul in May 2026 to fast-track solar-plus-storage projects specifically to meet surging data center power demand. The AI infrastructure buildout, concentrated heavily in PJM territory, has created an almost insatiable appetite for reliable, dispatchable clean power. That demand signal is now reshaping grid planning in real time.
The Rise of "Firm Solar": Storage Is No Longer Optional
Perhaps the most structurally important trend embedded in Q1's numbers is the mainstreaming of what the industry now calls "Firm Solar" — solar generation paired with battery storage and contracted to deliver power around the clock, not just when the sun shines.
According to the IRENA 24/7 Renewables Report, utility-scale solar-plus-storage attachment rates reached 78% globally in Q1 2026, up from just 45% in early 2025. In a single year, storage went from a premium add-on to a near-universal requirement written directly into procurement contracts.
This shift matters enormously for cost analysis. The average levelized cost of solar-plus-storage (LCOSS) dropped to $54 per MWh in high-irradiance regions by March 2026, per IRENA Cost Analysis 2026. At that price point, solar-plus-storage isn't competing with other renewables — it's undercutting gas peakers, coal plants, and even existing nuclear in dispatch economics.
"We have reached a tipping point where solar-plus-storage is no longer just a green alternative; it is the most economically viable and fastest-to-deploy solution for the AI power crunch." — Elena Vance, Lead Analyst, Global PV Insights
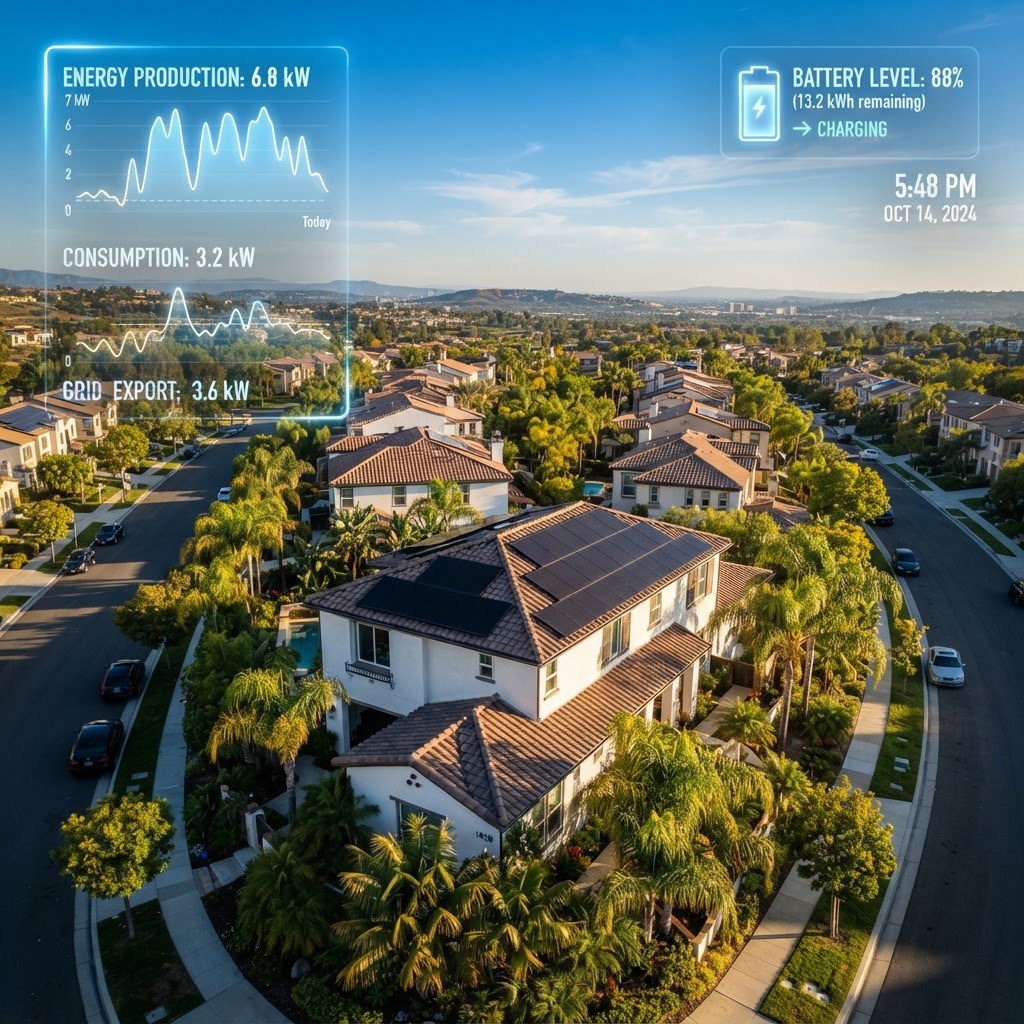
For California homeowners, this trend has a direct parallel. NEM 3.0's export rate structure has already made battery storage a near-financial necessity for new residential solar adopters in SCE, PG&E, and SDG&E territories. The global shift to Firm Solar at the utility scale validates exactly what Solanano's nano-grid philosophy has advocated since NEM 3.0 took effect: pairing solar with storage isn't gold-plating your system — it's building the only version of the system that fully pencils out.
Supply Chain Localization: America Builds Its Own Solar Stack
The 2024 supply chain disruptions that delayed projects and inflated costs across the US market accelerated a strategic response that is now paying dividends. US domestic module manufacturing capacity reached 65.5 GW at the start of 2026 — a 54% year-over-year increase from 42.5 GW in early 2025, according to SEIA/Wood Mackenzie Solar Market Insight.
Regional manufacturing clusters and what logistics analysts are calling "energy highways" — coordinated domestic supply chains linking wafer, cell, and module production — have meaningfully reduced lead times and shipping vulnerabilities. For project developers and residential installers alike, that means more predictable equipment availability and more stable pricing.
For California-specific buyers, this matters beyond supply chain abstraction. More domestically manufactured modules means broader eligibility for the SGIP battery storage incentive program and potential alignment with Buy American provisions that can affect ITC (Investment Tax Credit) qualification for commercial projects. At Solanano, our procurement analysis specifically tracks domestic content eligibility as part of every financial model we build.
India, the EU Mandate, and the Global Policy Engine
The US isn't carrying this surge alone. India commissioned a record 18.5 GW of solar capacity in Q1 2026, following a historic 50 GW full-year addition in 2025. India's scale is reshaping global panel pricing and supply dynamics in ways that directly benefit US buyers.
In Europe, the EU's "Solar Rooftop Mandate 2026" officially took effect in January, requiring solar installations on all new commercial buildings across member states. The policy is expected to add tens of gigawatts of demand annually while driving European manufacturing investment — further diversifying global supply chains away from single-country concentration risk.
Technology Inflection: Perovskite-Silicon Tandem Goes Mass Market
Behind the headline gigawatts sits a quieter but equally significant story: the modules going onto rooftops and in fields in 2026 are fundamentally better than anything available two years ago.
Leading manufacturers announced the successful mass-market rollout of 30% efficiency Perovskite-Silicon tandem modules in Q1 2026. Traditional P-type silicon cells typically max out around 21–22% efficiency in real-world conditions. Moving to 30% efficiency means:
- More power per square foot — critical for space-constrained California rooftops
- Better performance in partial shade or diffuse light conditions
- Smaller system footprints achieving the same energy output at lower cost
At Solanano, our shade analysis and satellite irradiance modeling tools are already being updated to account for the improved low-angle and diffuse-light performance characteristics of tandem modules. For homeowners in tree-lined neighborhoods or with complex roof geometries, this technology shift can meaningfully change what's feasible.
Emerging Trends Shaping Solar's Next Chapter
Beyond the Q1 numbers, several structural trends are defining the industry's trajectory:
-
AI-Driven Grid Orchestration: AI is being deployed for predictive maintenance and real-time Virtual Power Plant (VPP) management, helping utilities and aggregators stabilize electricity pricing volatility. California's CAISO grid is actively piloting VPP programs that enrolled home batteries can participate in — a revenue stream Solanano's financial modeling explicitly accounts for.
-
Agrivoltaics Expansion: Large-scale developers are rapidly adopting dual-use land models — solar arrays above active farmland — to navigate local zoning restrictions and agricultural land-use limitations. California's Central Valley is an active frontier for this approach.
-
Supply Chain Regionalization: The trend toward regional manufacturing clusters is accelerating, reducing both geopolitical risk and carbon footprint associated with long-haul module logistics.
What Q1 2026 Means for California Homeowners Right Now
The macro surge in solar isn't just a financial story or a climate milestone — it has tangible, near-term implications for California homeowners evaluating solar and storage:
- Equipment quality is at an all-time high while costs continue to fall
- Installer capacity is expanding, but vetted, experienced professionals remain in high demand — and quality still varies enormously
- NEM 3.0 financial modeling requires sophistication: the old "how many panels do I need" question has been replaced by complex time-of-use optimization and storage dispatch strategy
- SGIP incentives and IRA tax credits remain available but require careful qualification — particularly regarding domestic content and income-based adders
- Battery storage is no longer optional if you want the system to pay back on a competitive timeline under NEM 3.0
This is precisely the environment where independent advisory — not installer sales — delivers the most value. Solanano's four-stage installer vetting process (license and insurance verification, NABCEP certification, track record analysis, and performance scoring) exists because a record-growth market inevitably attracts firms that aren't ready to deliver at the level California's permitting complexity and NEM 3.0 economics demand.
Bottom Line
Q1 2026's 40% surge in global solar installations isn't a spike — it's a structural acceleration driven by regulatory reform, cost collapse, technology maturation, and a global energy demand story powered by AI infrastructure. The "great interconnection thaw," the rise of Firm Solar, domestic manufacturing scale-up, and 30% efficiency modules have converged to make this the most compelling moment in the history of solar energy adoption. For California homeowners, that means better technology, improving economics, and real urgency to act with the right guidance before incentive windows narrow further.
Ready to find out what Q1 2026's solar revolution means for your specific home, roof, and utility bill? Get your free, no-obligation solar assessment from Solanano — independent advice, zero conflict of interest, and hyperlocal California expertise built to help you get this right.